Observability
Inspect API Agents from Agent to Conversation to Run, then open an OpenTelemetry-style execution trace.Observability is the organization-admin view of Agent API activity. It keeps the Agent definition, durable Conversations, individual Runs, usage, files, and execution spans in one drill-down.
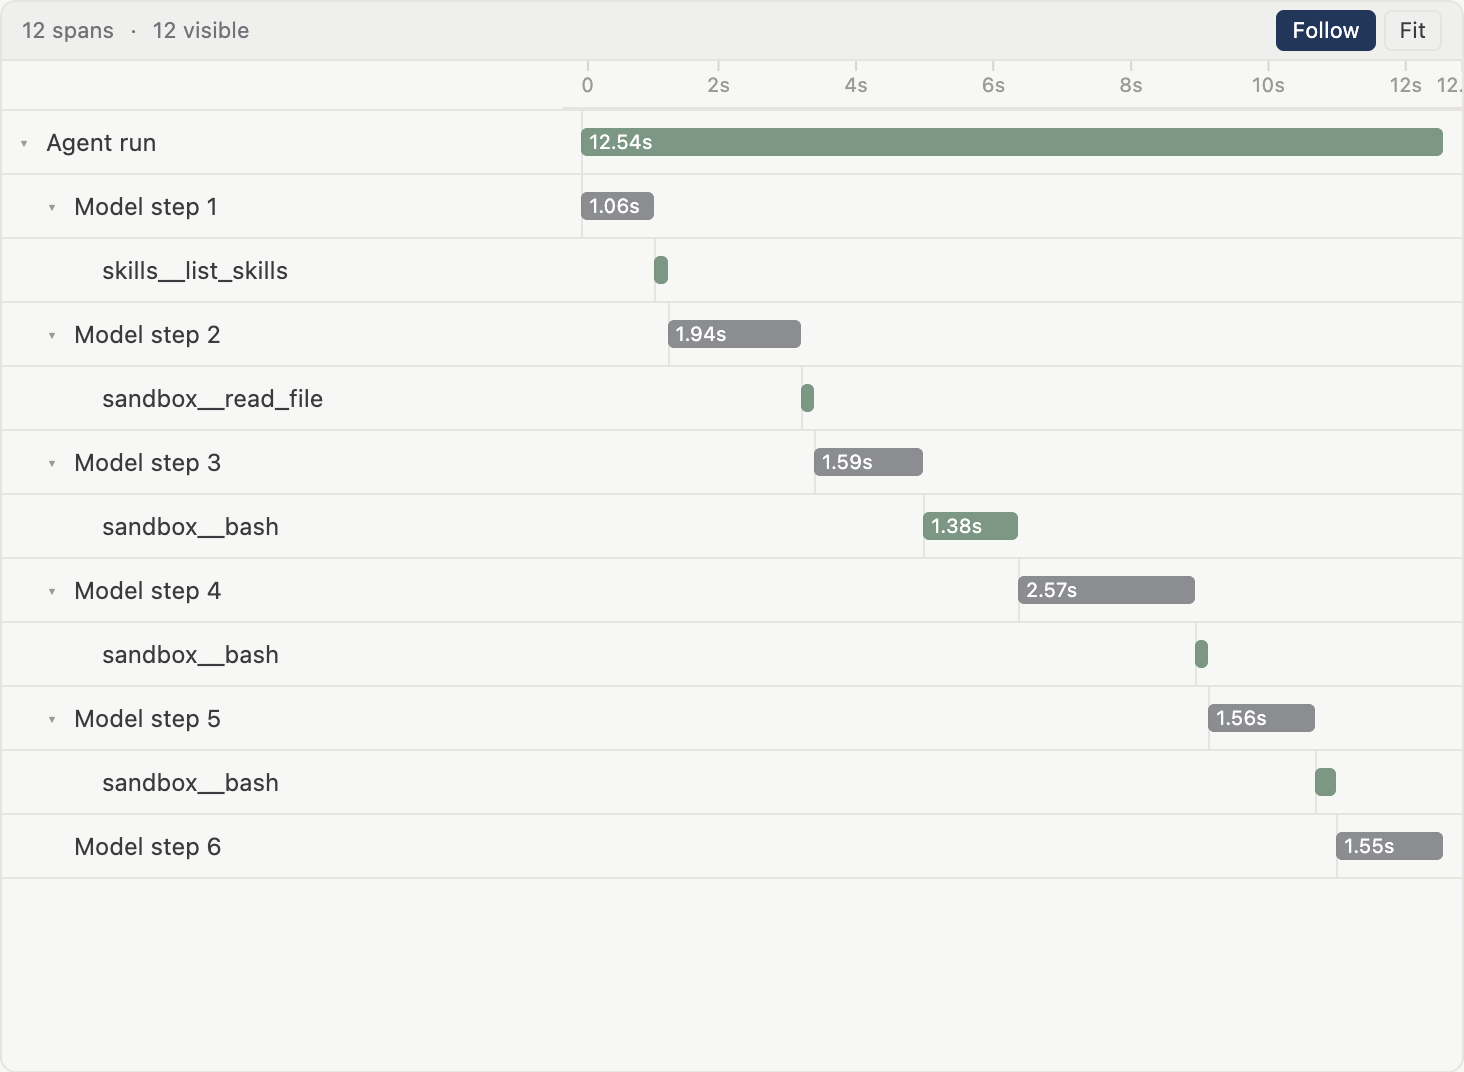
A live production Run. Customer input and file contents are excluded from this image.
Open a Run trace
- Sign in to Rebyte as an organization admin.
- Open Settings → API Agents.
- Select an Agent.
- Select a Conversation.
- Select a Run.
Each level loads its newest records first. Use Load more instead of loading the organization's entire history at once.
The hierarchy
API Agent
  └── Conversation
        └── Run
              ├── Agent run
              ├── Model step
              │     └── Tool call
              └── Model step
A Run in the observability UI is one stored Agent turn. The Responses API calls that turn a Response; the lower-level asynchronous API calls it a Message. Run is the inspection view, not another continuity resource.
What each level shows
| Level | Information |
|---|---|
| Agent | Model, maximum steps, Skill and MCP counts, Conversations, Runs, files, token use, spend, and last activity. |
| Conversation | Current state, Runs, files, token use, spend, and last activity. |
| Run | Run and Response IDs, status, start time, duration, input, output preview, token use, spend, tool count, and attached-file metadata. |
| Trace | Timed model-step and tool-call spans with status, input and output previews, errors, and recorded metadata. |
Read the waterfall
The root Agent run span covers the stored Run. Model steps are children of that root. A tool call is nested below the model step that requested it.
The horizontal position shows when a span started; its width shows elapsed time. Select a span to inspect:
- status, start, end, and duration;
- model or tool input and output previews;
- errors;
- step, action, and tool metadata;
- Run-level token, cost, tool, and file attributes.
Use Fit to place the complete Run on the timeline. Follow keeps an active trace aligned with its newest spans. On mobile, tap a span to open its details in the bottom sheet.
The waterfall is assembled from persisted Agent model-step and tool-action records. It is an OpenTelemetry-style view of Rebyte execution, not an ingestion endpoint for arbitrary OpenTelemetry traces or network-level spans.
Use the trace to improve an Agent
Start with the slowest or failed span, then determine whether the delay or error came from model work or a tool call. Use the Run totals to check token use and spend, and inspect the relevant span before changing the Agent.
You can then update its instructions, model, maximum steps, Skills, or MCP servers. Agent updates affect new Conversations; existing Conversations keep the configuration with which they were created. Create a new Conversation to verify the change. See Agents.
Access and data boundaries
- Only organization admins can open this view.
- It lists API-created Agents owned by the active organization. UI-managed Agents are not mixed into this list.
- The Run page can contain user input, model output, tool input and output, errors, and file metadata. Treat access as production-data access.
- Attached files are listed by metadata; the file contents are not rendered in the file list.
- The dashboard is the supported observability interface in this first version. Its administrator endpoints use the signed-in admin session, not an organization API key, and are not part of the public Agent API.